
I was asked by one of my readers to analyze the recently published Global Innovation Index and how it may relate to two democratic governance indices: Transparency International’s Corruption Perception Index and the Freedom House’s Index. These three metrics measure different conditions and factors in societies. But can these three indices be correlated and help explain innovation processes in a given country? While the correlations may seem obvious at first, analyzing how these three metrics intertwine can provide answers to questions such as how innovation is affected in a given country or territory, if at all, by perceptions of corruption or political rights and civil liberty conditions? Can countries or territories be innovative despite high corruption perceptions and dubious records on human rights? To what extent is innovation hampered by corruption and lack of human rights?
In a Nutshell: What each Metric Measures?
Before we analyze innovation in the context of the perception of corruption and conditions for human rights, it is important to understand what each of these metrics actually measures. The Corruption Perception Index (CPI) measures how corrupt each country’s public sector is perceived to be, according to experts and businesspeople. The CPI is presented on a scale of 0 (highly corrupt) to 100 (very clean). Each country’s score is a combination of at least 3 data sources drawn from 13 different corruption surveys and assessments. Since 1973, Freedom House has assessed the condition of political rights and civil liberties around the world. The conceptual framework is derived in large measure from the Universal Declaration of Human Rights, adopted by the UN General Assembly in 1948. The annual Freedom in the World report presents numerical ratings and supporting analysis by country or territory, which includes on-the-ground research, consultations with local experts, and information from news articles, nongovernmental organizations, governments, and a variety of other sources. The Freedom House index is a product of 25 indicators for a maximum of 100 in a scale where 0 measures lack of conditions and 100 measures adequate conditions. These indicators focus on analyzing the conditions for citizens in countries and territories to exercise their political rights and civil liberties. Based on the scores countries/territories are classified in three categories: Free, Partly Free, or Not Free.
The Global Innovation Index (GII) was launched in 2007 with the aim of identifying and determining metrics and methods that could capture a picture of innovation in society that is as complete as possible. The GII adopts a broad definition of innovation, which focuses on “new or improved products or processes (or a combination thereof) that differs significantly from the unit’s previous products or processes and that has been made available to potential users and brought into use.” The overall GII ranking is based on two sub-indices that are equally important in presenting a complete picture of innovation: the Innovation Input Sub-Index and the Innovation Output Sub-Index. Ultimately the GII is calculated by taking the weighted average of its individual indicators’ scores, on a scale of 1 (low) to 100 (high), which helps produce the innovation score and ranking respectively. The Input sub-index of the GII includes indicators related to the institutional environment (political, regulatory, and business); human capital and research (education and research & development); infrastructure (general, information and communication technology, and sustainability); market sophistication (trade, investment); and business sophistication (knowledge workers, innovation linkages and knowledge absorption). The Output sub-index of the GII includes indicators related to knowledge and technology and creative outputs (assets, goods and services, and online creativity). See the global map of the GII in Figure 1.

A High-Level and Panoramic Analysis
After a summary of what each of these indices measures, a high-level and panoramic analysis of the country rankings could provide evidence for some initial hypotheses. For example, when looking at the top 10 ranked countries in each of the three indices (GII, CPI, and Freedom House), only 4 countries coincide in the top 10 rankings: Sweeden, Netherlands, Finland, and Denmark. While their rank within the top 10 of each of the three metrics is not the same for these 4 countries, an initial hypothesis could be that where there are low levels of perceived public corruption and high human rights conditions, innovation, as measured by the GII, has relatively high results. Another initial hypothesis could be that high innovation captured by the GII promotes more public transparency and strengthens political rights and civil liberties. When we analyze the bottom 10 ranked countries in each of the three indices, a different picture emerges as there is not a single country that is ranked in all three. Yemen is ranked in the bottom 10 in the GII and CPI rankings, but Freedom House ranks Yemen in the bottom 12 countries. Nonetheless, one can make the argument that in the particular case of Yemen, innovation is being curtailed by the lack of political rights and civil liberties and the high perception of public corruption. With few exceptions countries ranked in the bottom 10 of the GII, are ranked in the lower quartile of the CPI (except Benin and Niger) and are classified as Not Free or Partially Free by Freedom House. Thus, there seems to be a larger tendency for countries with a relatively high perception of public corruption and relatively low conditions for political rights and civil liberties to be ranked in the bottom 10 of the GII.
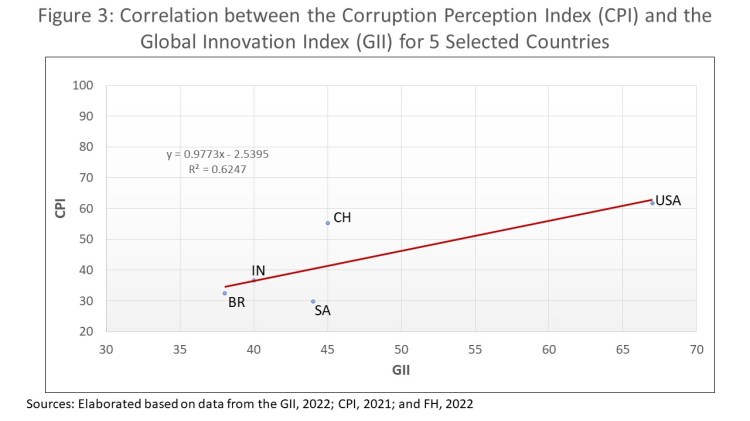
Beyond the top and bottom 10 ranks countries, what about if we apply our analysis to specific countries? We pre-selected five countries using the GII income category: one from the high-income group (United States), three from the upper-middle-income group (China, Brazil, and South Africa), and one from the lower middle-income group (India). They represent different regions across the world, and four host the largest populations in the world. Below are some insights (see a graphical comparison by metric of these countries in Figure 2):
- The United States for example ranks second in the GII with a score of 61.8/100 and registers a CPI score of 67/100, which positions it in the top quartile of the CPI scale. In the Freedom House index, the United States scores 83/100, is categorized as Free, and lands in the upper part of the second quartile of the ranking. Freedom House points out that while still categorized as Free, over the past decade the United States has consistently shown a declining trend in its index.
- China ranks 11 in the GII with a score of 55.3/100 and registers a CPI score of 45/100, which places it at the top of the last quartile in the CPI scale. In the Freedom House score, China has a 9/100 score and is categorized as Not Free, and of the 56 countries designated as Not Free by Freedom House in 2022, China had the worst aggregated scores for political rights and civil liberties.
- India ranks 40 in the GII with a score of 36.6/100 and registers a CPI score of 40/100, which places it along with China in the last quartile on the scale. In the Freedom House score, India has a 66/100 score and is categorized as Partially Free. Freedom House points out to a series of setbacks in India in political rights and civil liberties over the past couple of years.
- Brazil ranks 54 in the GII with a score of 32.5/100 and registers a CPI score of 38/100, which positions it in the bottom quartile of the CPI scale. In the Freedom House index, Brazil scores 73/100, is categorized as Free, and lands in the second quartile. Freedom House points out that Brazil has shown one of the sharpest declines in political rights and civil liberties in South America over the past 10 years.
- South Africa ranks 61 in the GII with a score of 28.3/100 and registers a CPI score of 44/100, which positions it in the bottom quartile of the scale. In the Freedom House index, South Africa scores 79/100, is categorized as Free, and lands in the second quartile. Freedom House has highlighted concerns in relation to growing inequality and violence, which are threatening rights and liberties.

There seems to be some correlation between the GII, the CPI, and the Freedom House scores, in particular in the case of the United States. The hypothesis here would be that a relatively high perception of transparency of its public institutions and the enabling conditions for rights and liberties, has a positive effect on innovation in the United States. For India, Brazil, and South Africa, the correlation is inverse. So, the hypothesis would be that the relatively high perception of corruption in their public institutions and the relative sub-optimal conditions for rights and liberties, curtails innovation. China is an anomaly or out layer in the analysis, as despite registering a relatively high perception of corruption in public institutions and very low conditions for rights and liberties, it still has a high score in the GII.
Unpacking Innovation and Democratic Governance: Three more Cases
To further unpack and analyze potential correlations between the three metrics, we pre-selected three additional countries that are smaller in population and economy size, represent different regions and have some unique features.
- Singapore is a country that often comes into conversations about ideal governance models and outcomes. Singapore is ranked 7 in the GII with a score of 57.3/100. Singapore is number one in the world on 11 indicators of the GII, including government effectiveness, information and communication technology (ICT) access, venture capital investment, and high-tech manufacturing. Singapore ranks 4 in the CPI with a relatively high CPI score of 85/100 in terms of transparency and low perception of public corruption. Freedom House rates Singapore with a 47/100 score and categorizes it as Partially Free. According to Freedom House, Singapore’s parliamentary political system has been dominated since 1959 by the ruling People’s Action Party (PAP) and the family of current prime minister Lee Hsien Loong. The electoral and legal frameworks that the PAP has constructed allow for some political pluralism, but they constrain the growth of opposition parties and limit freedoms of expression, assembly, and association. An argument can be made that Singapore has a constraining system of governance but is perceived to deliver benefits to the population as a whole, and not only to the governing class. As such, some political and civil liberties are allowed and some democratic decision-making exists, through public referendums or elected representatives with limited power. The scores on the three different indicators point to a hypothesis that innovation in this case is not being curtailed by limited rights and liberties.
- Chile is a country that is known for its strong institutional tradition. Chile is ranked 50 with a score of 34/100 in the GII. Chile is the only Latin American country in the top 50 and leads the Latin America and Caribbean region as the top innovator. Chile ranks 27 in the CPI with a score of 67/100 and is tied with the United States in the ranking. Freedom House describes Chile as a stable democracy that has experienced a significant expansion of political rights and civil liberties since the return of civilian rule in 1990. Freedom House rates Chile with a 94/100 score and categorizes it as Free. This would be the case where relatively low perceptions of public corruption and high conditions for rights and liberties do not necessarily translate into higher levels of innovation.
- Mauritius is an island country with the highest population density of African countries and is among the highest in the world. Mauritius has the highest GII score and ranking for the African region. Ranked 45 in the GII, with a score of 34.4/100. Mauritius leads Africa in indicators related to institutions, infrastructure, market sophistication, and creative outputs. Globally Mauritius leads in venture capital deals, trademarks, ICT services imports, and new businesses. Despite its good reputation in democratic governance Mauritius has had to deal with legal, regulatory, and enforcement measures in the fight against money laundering and corruption. Mauritius ranks 49 in the CPI with a mid-level score of 54/100. Freedom House rates Mauritius with a score of 86/100 and categorizes it as Free. Freedom house highlights that Mauritius is home to an open, multiparty system that has allowed for the regular handover of power between parties through free and fair elections. Civil liberties have historically been upheld but have recently experienced limitations, including for journalists’ reports, women, and LGBT+. This case could nourish a hypothesis that relative mid-levels of perception of public corruption and relatively high conditions for rights and liberties can have positive effects on innovation.
Some General Takeaways
In this initial analysis, we wanted to articulate the GII, the CPI, and the Freedom House index. While these indices measure different conditions in societies and cover a different number of countries, they each score and rank countries and provide a metric to compare across countries. As such, we wanted to find out the relationship and correlation between innovation and perceptions of public corruption and conditions for human rights. We posed some initial questions, such as how is innovation affected in a given country or territory, if at all, by political rights and civil liberty conditions or by perceptions of corruption? Can countries or territories be innovative despite dubious records on human rights and anti-corruption? To what extent, is innovation hampered by corruption and lack of human rights?
The result of this initial analysis is mixed and requires further inquiry and research to dive deeper into correlations and causality. However, the initial analysis shows that in some cases, there seems to be a link between innovation and perceptions of corruption (see Figure 3) and conditions for human rights, while in others the link is less obvious, and there are even cases that reflect anomalies regarding the relationship and correlation of the three metrics.
Innovation is a process that requires inputs to produce outputs. It involves different actors like the government, the private/business sector, universities, and workers. Innovation involves operating in domestic and international environments. As such, factors like the impact of the COVID-19 pandemic, the current global geopolitical turmoil and war in Ukraine, monetary policies, and the repercussions of democratic backsliding play a role in innovation processes. The GII does not offer any guidance on how to incorporate these variables into measuring innovation but understanding how these may affect conditions for innovation could be of value to promote, adapt and strengthen policy and actions.
The governance of innovation is also key, as it involves actions of creative individuals and organizations, decisions, and public and private support of efficient structures. How this virtuous circle works to effectively manage inputs, and produce outputs as well as sustainability, is a different issue altogether. But what was clear from the latest GII report is that the existence of this virtuous circle and its dynamic is what ultimately produces knowledge and expertise which forms the basis of sound decision-making, ensuring alignment of innovation strategy and implementation. No question that innovation needs Research and Development (R&D), venture capital, quality of universities, quality and impact of scientific publications, patents by origin, computer software spending, and public-private partnerships, and these are all key inputs. However, how this comes together in each country is not clear from the report.
Also, legislative initiatives to publicly fund research and development, to provide tax incentives, and encourage public–private partnerships for innovation seem to play a role in innovation. Although, what happens when the legislative process and the legislative entity itself have been captured by narrow interest, are not independent, and are influenced by coercion and political pressures, or when there is no transparency in budget allocation, are areas that are not analyzed in the report. Finally, innovation depends on business incubators and accelerators to foster entrepreneurship and promote a start-up culture. This assumes that the conditions for entrepreneurship and private property exist and are accessible to everyone.
Ultimately, innovations need to have benefits for humanity. The definition of innovation used by the GII report is broad, which makes it difficult to analyze the type of outputs that are the product of innovation. It is different from an innovation that makes missiles more effective for war and terror than an innovation that helps to find a cure for a disease. This is where additional analysis of the GII with other metrics, like the perception of public corruption, conditions for human rights, and other democratic governance indicators (rule of law, citizen participation, transparency, and accountability) could complement the understanding of innovation beyond the number/index/rank. One trend we highlighted in this initial analysis is that the correlation between the GII and the two democratic governance indicators is relatively positive. Of the top 20 GII-ranked countries, the majority are also the top 20 CPI-ranked countries and the top 20 countries in the Freedom House index. Moreover, of the top 20 GII-ranked countries, only China is the country with low numbers in rights and liberties as measured by Freedom House. In the top 50 ranked GII countries only 12% of the countries are considered Not Free by Freedom House. When we analyze the bottom 20 ranked countries in the GII, 50% are classified as Not Free and 50% as Partially Free by Freedom House. Not a single country in the bottom 20 ranked is classified as Free. Among the bottom 50 ranked countries in the GII, only 10% are considered Free by Freedom House, the rest are either Partially Free or Not Free.
A key challenge is to find metrics that capture innovation in all of its dimensions, including democratic governance. For example, many of the 134 countries in the GII, do not disclose amounts of investment for innovation or a list of innovative products that have been produced. No doubt, the GII is a useful metric, but it does not fully capture the dynamics of conditions, perceptions, and governance approaches. A key observation is that the GII scores and rankings are not directly comparable between one year and another, as innovation is a dynamic process that requires constant updating. Also, explaining outliers or anomalies in the context of democratic governance contexts can enrich the understanding of innovation and additional conditions, like transparency, that promote and encourage innovations.
*Source of the photo: Pexels, 2023

Interesting post. I don’t know a lot about the other two indices, but the Global Innovation Index has some issues. Without some more scientific way to weight the indicators, I’m not sure how valid its results are. Using factor analysis or principal component analysis might help to improve its rigour.
LikeLike